Have you heard the saying, “if you don’t like the weather wait a day and it will change”? The same could be said of the markets. The first quarter of 2023 included three unique months, in January the S&P 500 had a stellar start gaining 6.2% while the NASAQ Composite added 10.7%. In February the markets weakened, and the S&P 500 retreated 2.61% while the NASDAQ was off only .4%. During March the markets navigated the fallout around several regional bank failures. Although the Federal Reserve Board, along with the Treasury and the President assured complete protection to the depositors at these institutions, the stocks of many other regional banking securities suffered impressive price volatility.

A major factor in the crisis that evolved for these regional banks centered around the duration of the assets that the banks invested reserve deposits into. The Federal Reserve raised interest rates 7 times in 2022 and twice so far in 2023. The pace and level of interest rate spikes has had a negative impact on the market value of existing bonds, particularly affecting values on longer term bonds. Several of the banks involved had large holdings in 10 year Treasuries with comparatively low yields in the current market environment causing the liquidity value of these bonds to be reduced. At the same time inflation remains a dominant factor in the economy and markets. The February CPI came is at 6%, cooling slightly but remaining stubbornly well above the Fed target of 2%. These factors have led to a recalibration of the Fed’s path, causing the most recent decision to raise interest rates by .25% in March and signal that they are near the end of raising rates. Data-dependent future interest rate changes potentially could include a pause or reduction in rates. Historically markets have responded positively to rate hike pauses and specifically to interest rate declines.
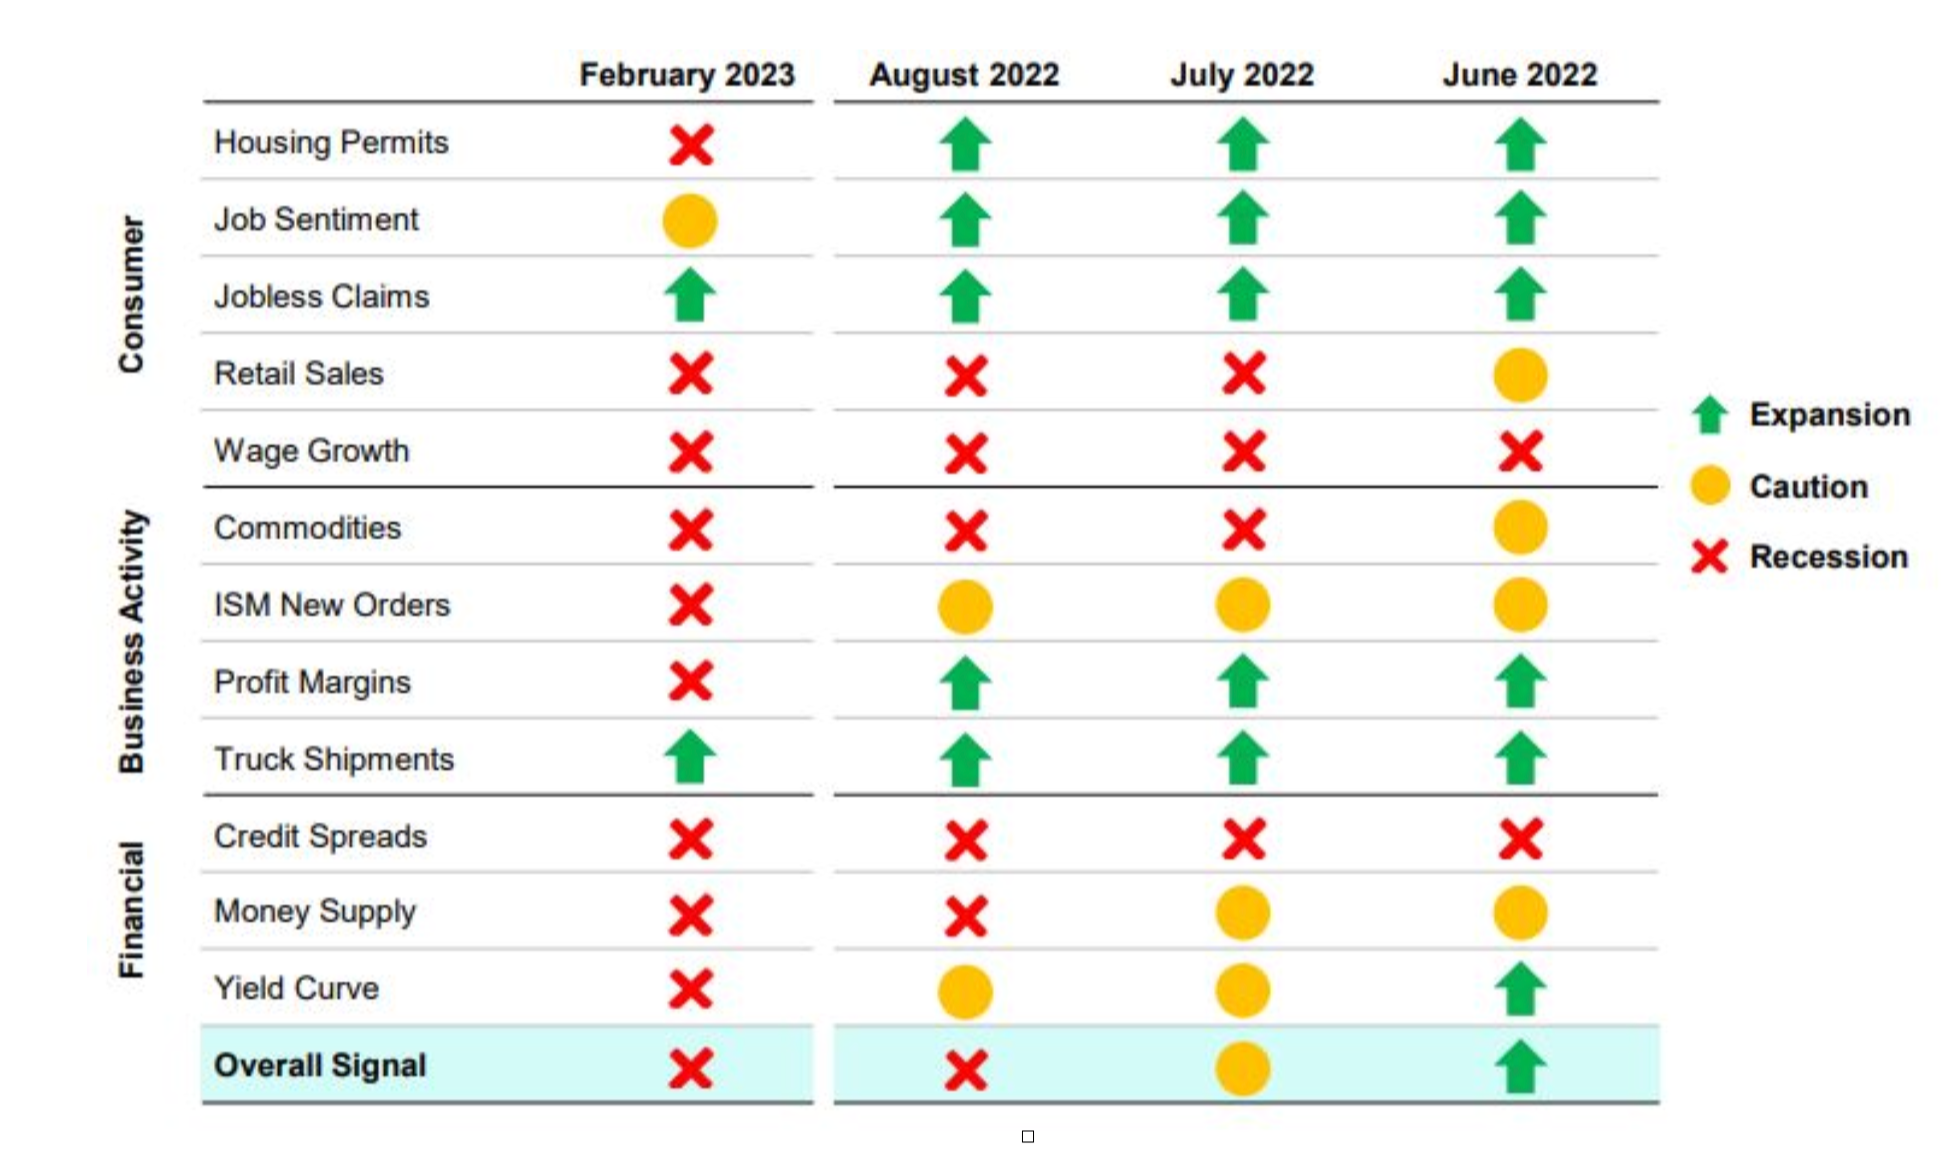
It is important to note that recessionary pressures continue to increase. It seems probable that lending and credit will tighten, reducing access to credit for borrowers and increasing the cost of capital, resulting in slower economic growth.

Data as of Feb. 28, 2023. Source: BLS, Federal Reserve, Census Bureau, ISM, BEA, American Chemistry Council, American Trucking Association, Conference Board, and Bloomberg. The ClearBridge Recession Risk Dashboard was created in January 2016. References to the signals it would have sent in the years prior to January 2016 are based on how the underlying data was reflected in the component indicators at the time.
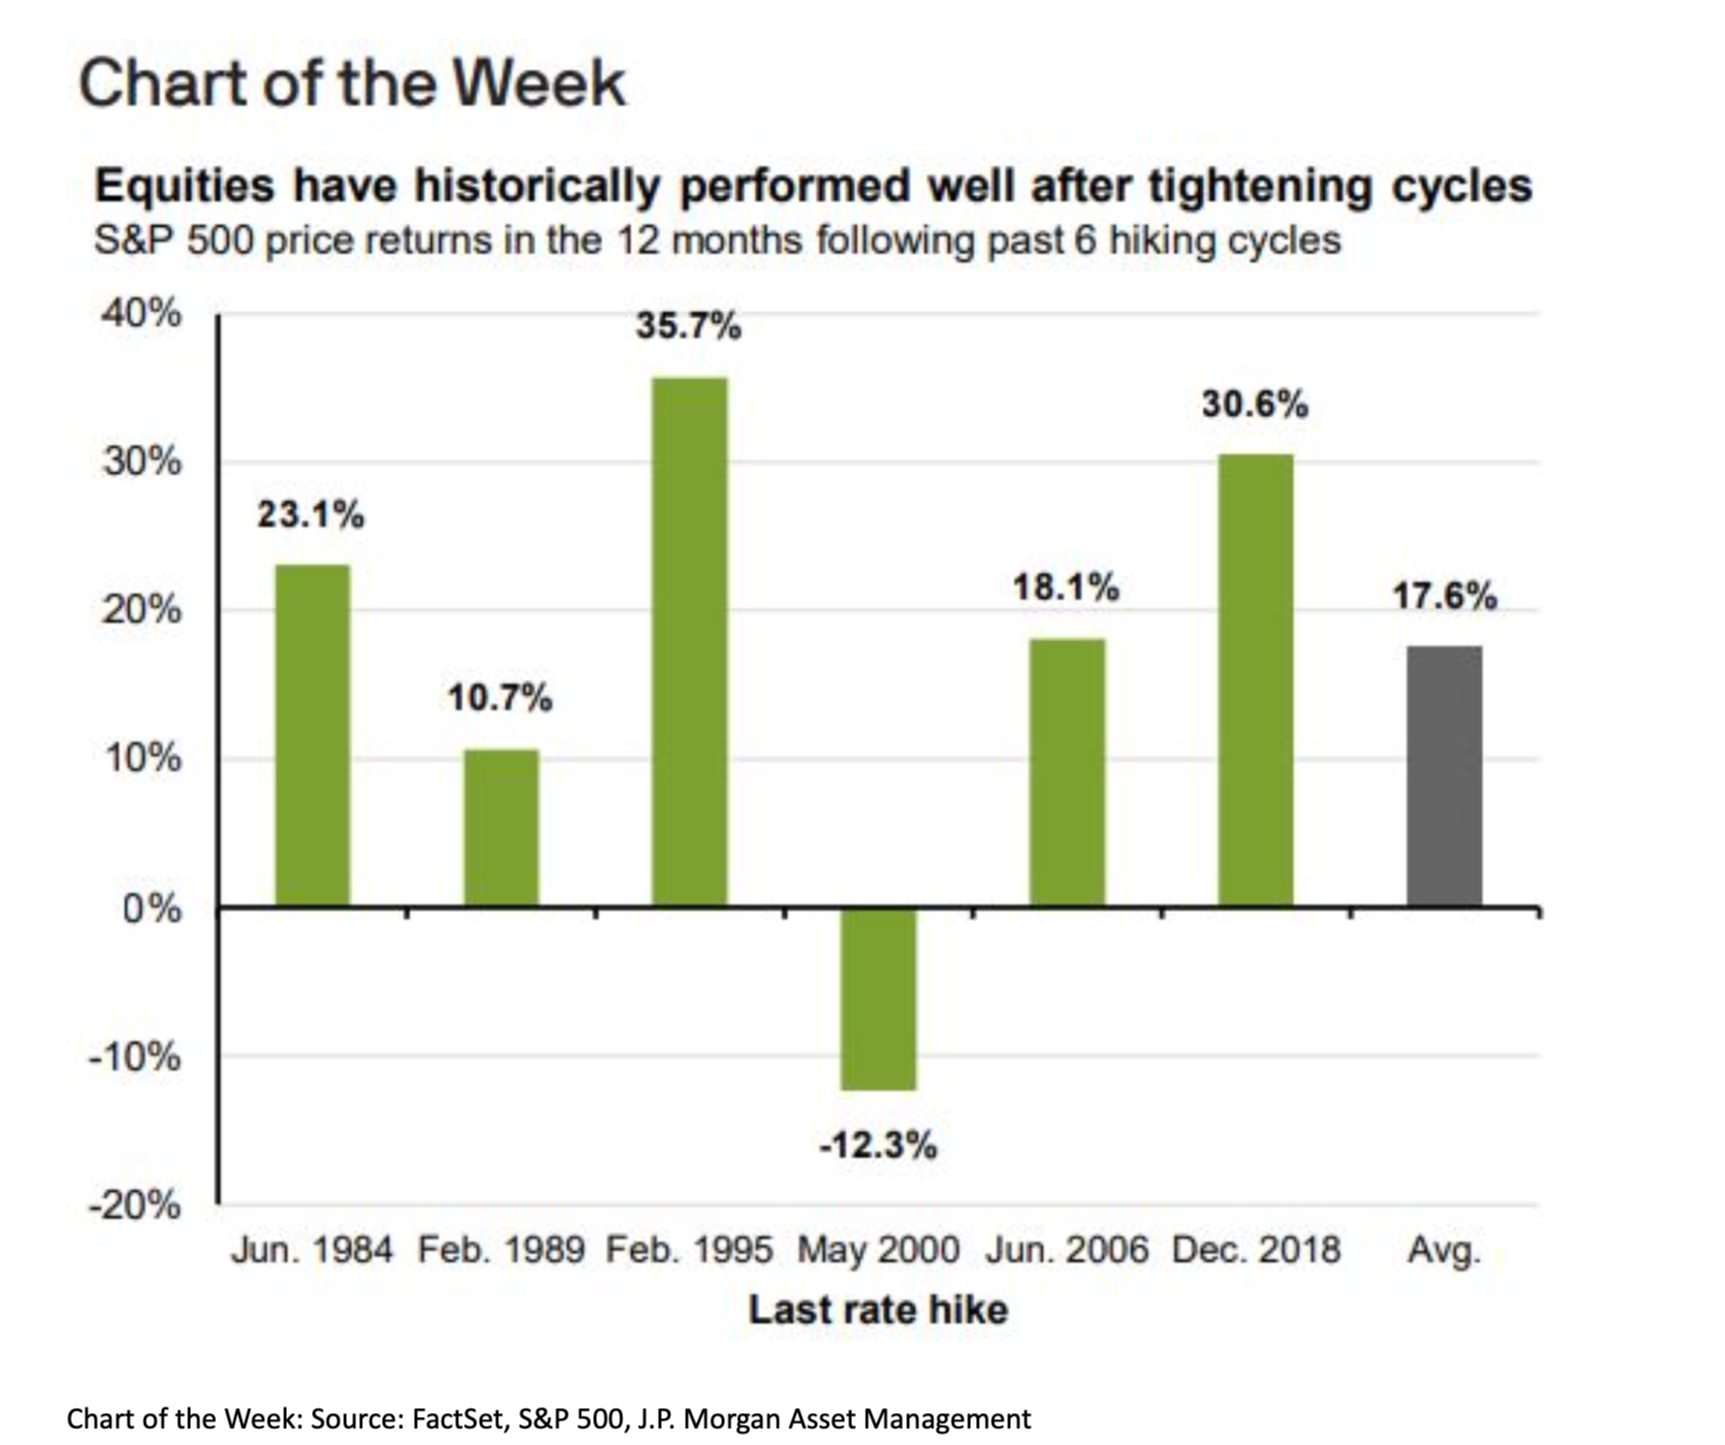
As long-term investors, however, we realize that the current state of affairs is by no means the end of the story. We remain focused on the inevitable shifts in the economy and look forward to the return to a more growth-oriented cycle. Certainty regarding the timing of this shift eludes even the greatest economists and minds on Wall Street. We can, however, look to history to provide some insight into potential future results. Historically, equities have performed well following tightening cycles.
As always, our team of advisors are available to discuss the latest updates and market changes as they apply to your portfolio of investments. We remain steadfast in our dedication to assisting our clients navigate every market cycle while focusing on the important task of achieving long-term financial goals and success.
– The Investment Management Team
